This is an old revision of the document!
Table of Contents
Eclipse IDE
The Eclipse IDE Integrated Development Environment is open source and provides an excellent environment to develop web applications. I migrated the LAMP server from XAMPP to WSL (Windows Subsystem for Linux) with the arrival of Windows 10. See here for XAMPP related instructions.
| Application | Version |
|---|---|
| Eclipse for PHP Developers | 2024-03 |
| OS | Debian 12.5 |
| Apache | 2.4.59 |
| PHP | 8.3.7 |
| MariaDB | 10.11.61 |
LAMP with Xdebug
- Follow LAMP on Debian 12
- Review your php.ini:
output_buffering=off
short_open_tag = On
max_execution_time=120
max_input_time=150
max_input_vars = 2000
memory_limit = 512M
error_reporting=E_ALL & ~E_DEPRECATED & ~E_STRICT
display_errors=On
post_max_size = 32M
sys_temp_dir = "/tmp"
upload_tmp_dir = "/tmp"
upload_max_filesize=128M
date.timezone=Asia/Bangkok
WSL (Windows Subsystem for Linux)
WSL1
- WSL1 runs networking in
bridgedmode - You do not need to set
xdebug.client_host(Xdebug2:xdebug.remote_host) - Will work with default configuration settings
WSL2
- WSL2 runs networking in
NATormirroredmode - WSL2: run the following command in PowerShell:
New-NetFirewallRule -DisplayName "xdebug" -InterfaceAlias "vEthernet (WSL (Hyper-V firewall))" -Direction Inbound -Protocol TCP -LocalPort 9003 -Action Allow
- Check with:
Get-NetFirewallRule -DisplayName "xdebug"
- Check logfile with tail -f /path/to/log/xdebug.log
Links
Eclipse IDE
Java
Eclipse requires Java to run, so install this first.
- Install Java Runtime Environment 32 Bit Version or 64 Bit Version
- If you have recently installed Java 8 and uninstalled older versions, install Java SE Development Kit 8 and retry.
- If you get a Java was started but returned exit code=13 error, you most likely installed the wrong Java version. Try re-installing Java with the 64-bit version, or vice versa.
Eclipse
- Install Eclipse for PHP Developers
- Choose x:\ as installation path, where “x” can be any drive letter available to your system, also a portable one.
XDebug for PHP 7.2
To activate the debugger, you need to add the following lines to the bottom of x:/xampp/php/php.ini:
[XDebug]
zend_extension = "C:\xampp\php\ext\php_xdebug-2.6.1-7.2-vc15.dll" ; IMPORTANT: Windows does not find the dll if the drive letter is missing!
xdebug.remote_autostart = 1
xdebug.profiler_append = 0
xdebug.profiler_enable = 0
xdebug.profiler_enable_trigger = 0
xdebug.profiler_output_dir = "\xampp\tmp"
;xdebug.profiler_output_name = "cachegrind.out.%t-%s"
xdebug.remote_enable = 1
xdebug.remote_handler = "dbgp"
xdebug.remote_host = "127.0.0.1"
xdebug.remote_log = "\xampp\tmp\xdebug.txt"
xdebug.remote_port = 9000
xdebug.trace_output_dir = "\xampp\tmp"
xdebug.remote_cookie_expire_time = 36000
- Other options can be left at default values. Check the settings have been recognized by checking phpinfo.
- XAMPP does not contain the correct php_xdebug.dll, download it from here and put it into folder x:/xampp/php/ext.
- Make sure you have Visual C++ 2017 installed.
- Download and install: Installing Xdebug for XAMPP with PHP 7.x and The latest supported Visual C++ downloads
- Check phpinfo: Tailored Installation Instructions
XDebug for PHP 5.6
To activate the debugger, you need to add the following lines to the bottom of x:/xampp/php/php.ini:
[Xdebug]
zend_extension=H:\xampp\php\ext\php_xdebug.dll
xdebug.remote_enable = 1
xdebug.remote_port = 9000
xdebug.trace_output_dir = "\xampp\tmp"
Other options can be left at default values. Check the settings have been recognized by checking phpinfo. xampp comes with the correct php_xdebug.dll file already located in x:/xampp/php/ext.
Links
JavaScript
Links
TypeScript
Install the TypeScript IDE for Eclipse.
- In Eclipse go to Help → Install New Software…
- Provide the installation location http://axmor.bitbucket.org/typecs/stable/update-site/
- Mark the plugin version you would like to install then press Next…
- On Install Details press Next…
- Review and confirm the plugin to install.
- Restart Eclipse.
Settings
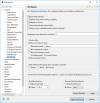
- Go to Window → Preferences → General and enable “Show heap status”.
- There are three places where the “Break on first line” configuration can be set:
- Window → Preferences → PHP → Debug
- Project → Properties → PHP → Debug
- Run → Debug Configurations → PHP Web Application → <Your configuration> → Debugger
- If you have existing projects
- either select the project directory as workspace when first starting up the new eclipse, or
- delete the workspace directories and files (filenames start with “.”), then import the project directories with File –> Import –> General –> Existing Projects into Workspace


